.svg)
Divergences help traders identify weakening trends which may signal a reversal or continuation. These 9 essential rules will guide you in applying divergences effectively.
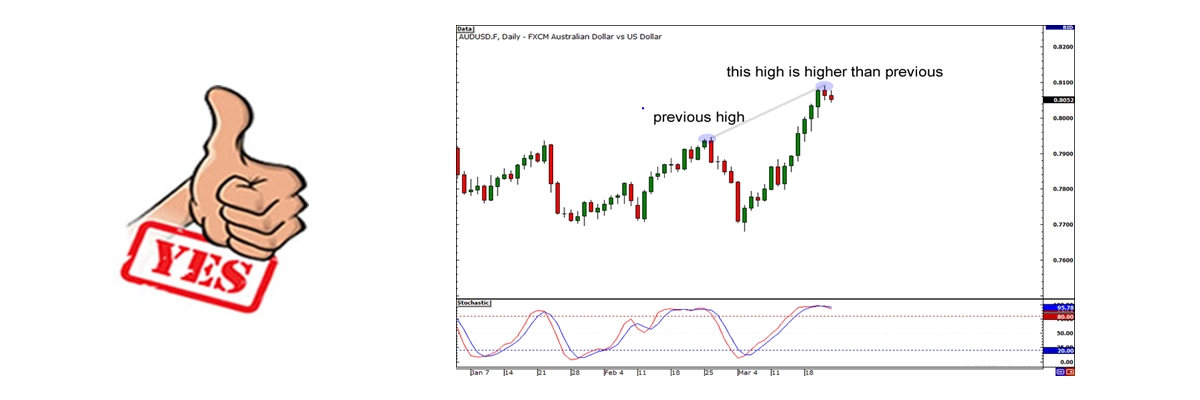
Price must form Higher High, Lower Low, Double Top, or Double Bottom. If these patterns are absent, no divergence exists.
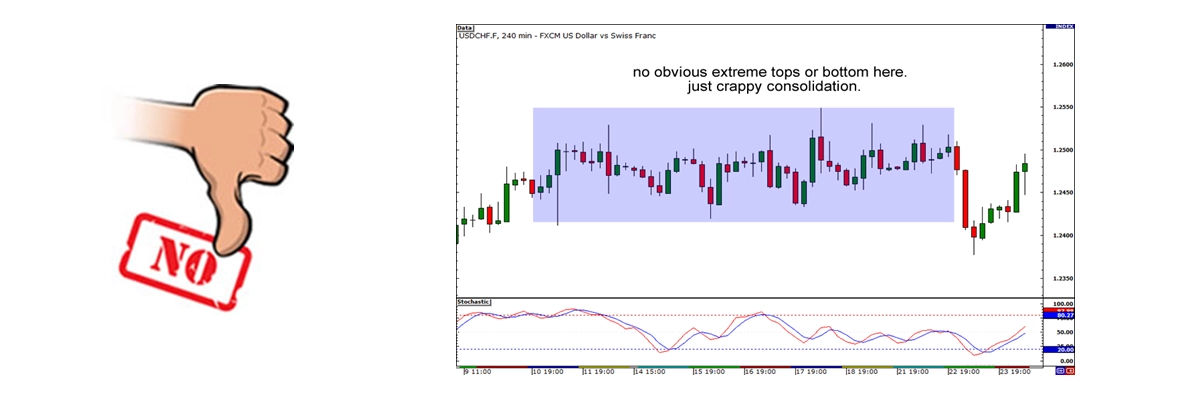
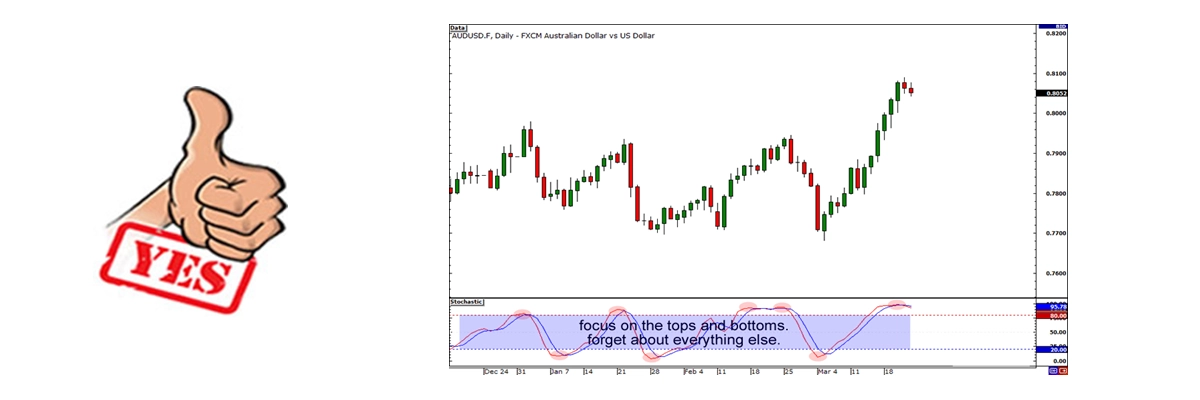
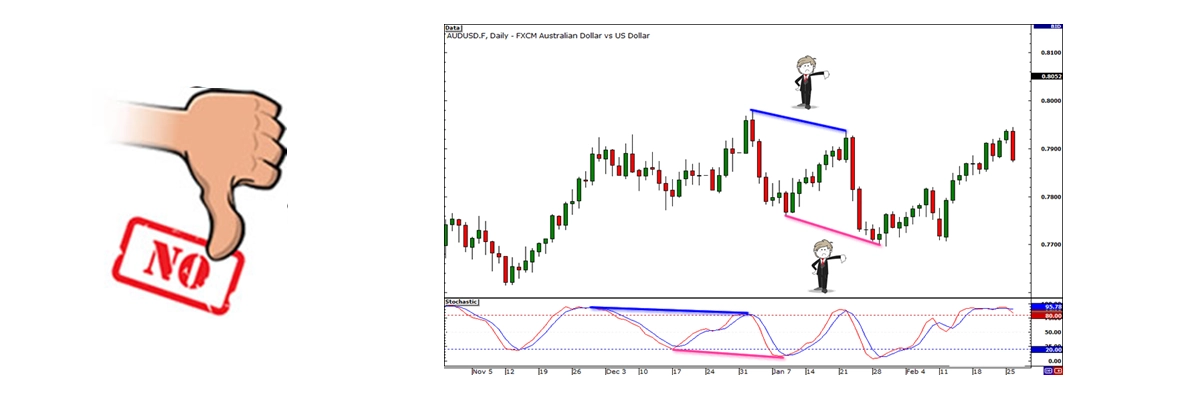
Focus on major swing highs and lows; ignore minor bumps when drawing lines to determine divergence.
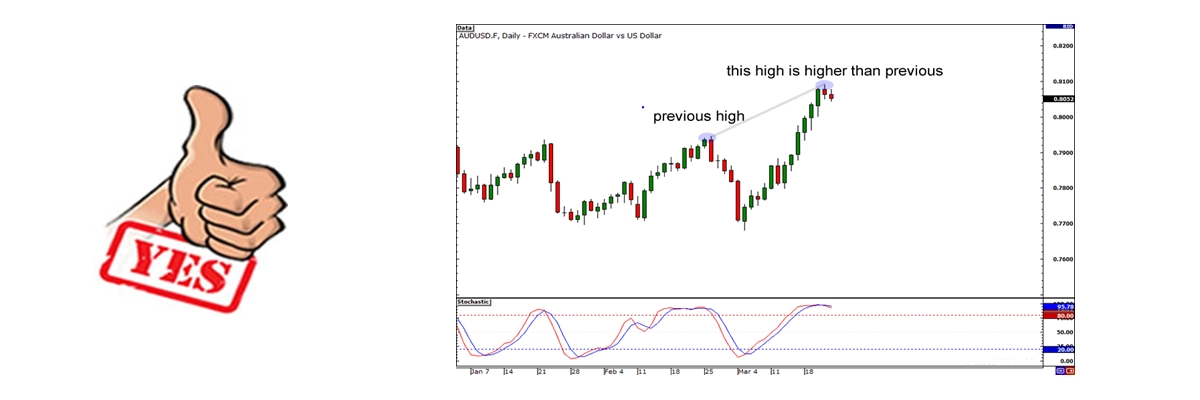
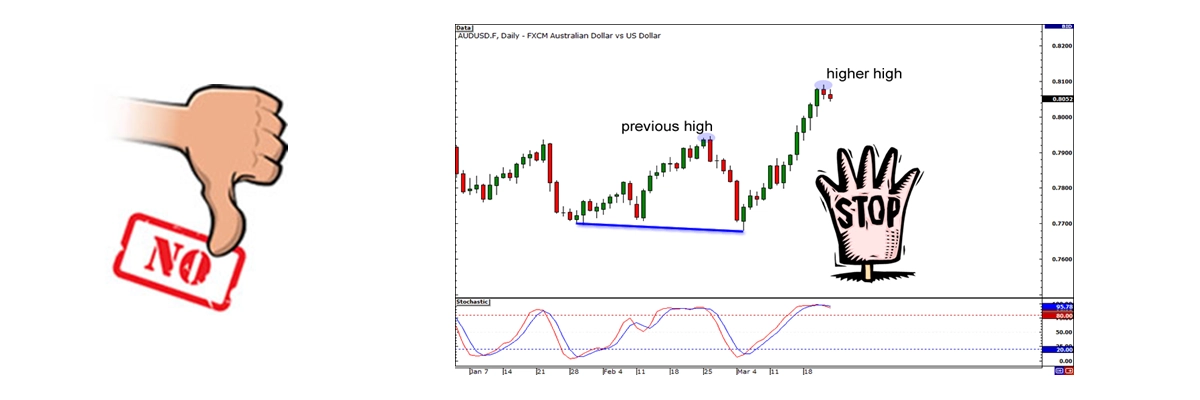
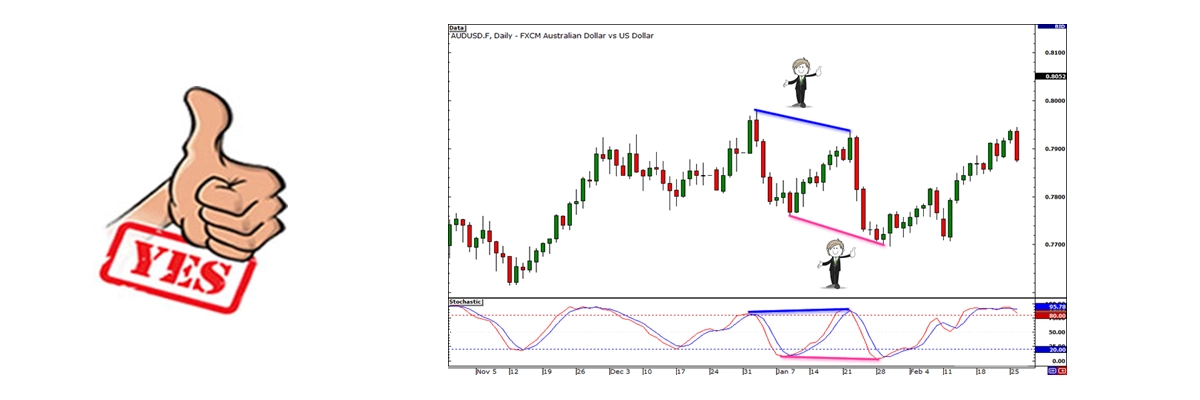
Connect highs with highs and lows with lows to accurately identify divergence.
Compare price tops/bottoms with indicator tops/bottoms. Focus on main swings, ignoring noisy indicators.
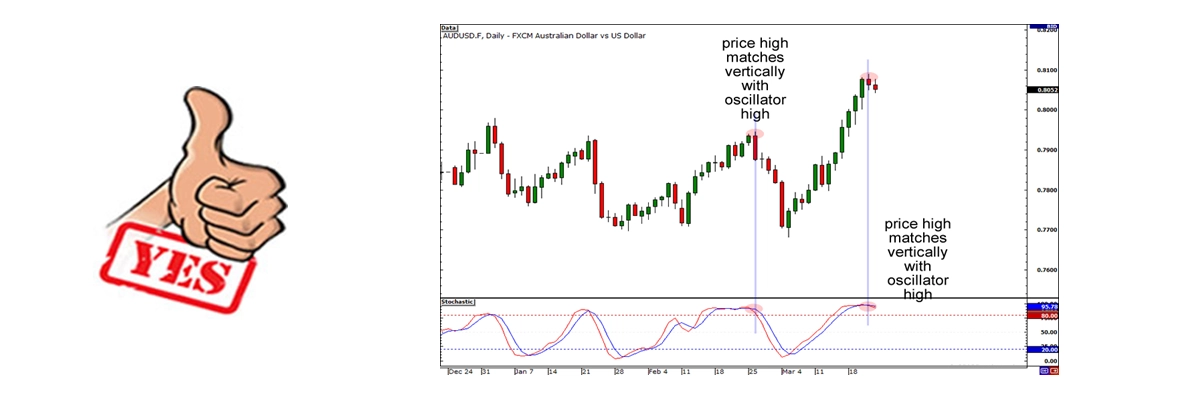
Highs and lows on price charts must align with corresponding indicator highs and lows.
Highs/lows on indicators must align vertically with price highs/lows.
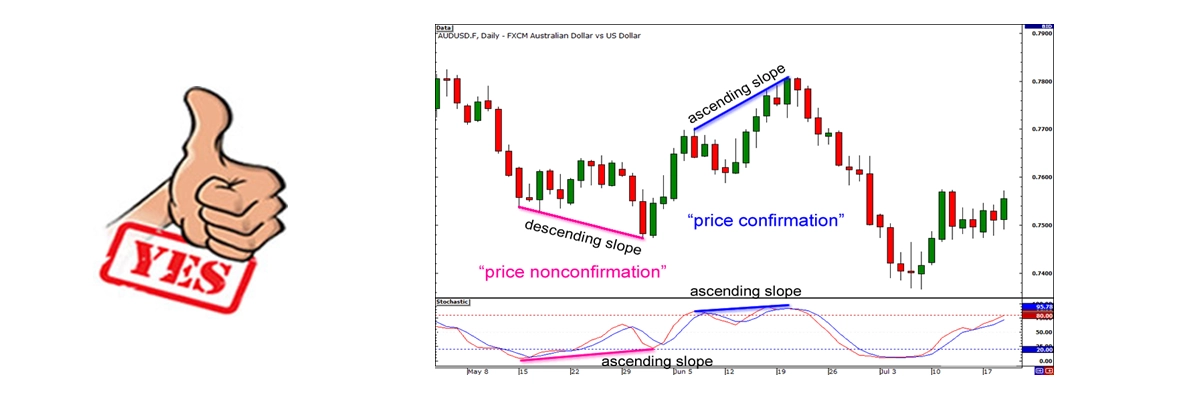
Divergence exists only if the slope of the price line differs from the slope of the indicator line.
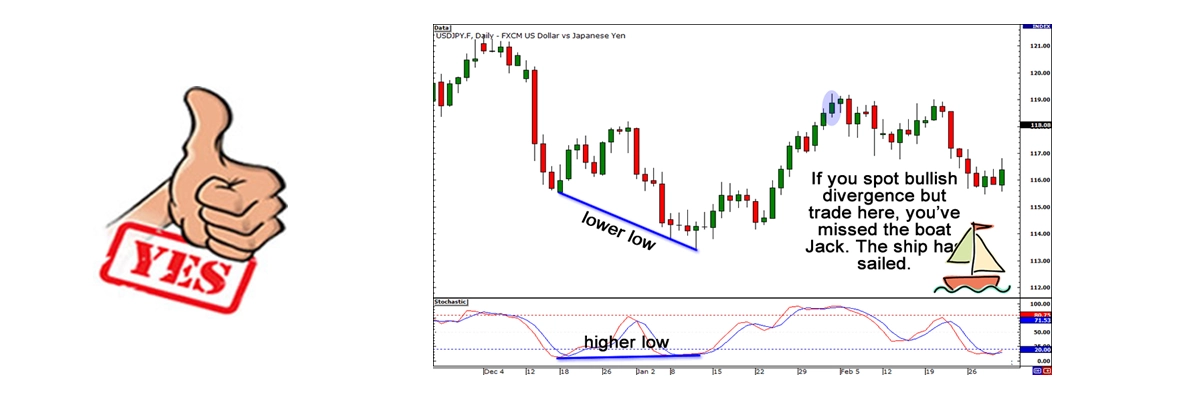
If divergence has already played out, wait for the next swing structure.
Divergences are more reliable on 1-hour charts or higher. Shorter timeframes are noisy but frequent.
Following these 9 rules ensures disciplined, responsible trading with higher success potential. Combine divergence analysis with clear risk management and informed decisions.
Disclaimer : All content is for informational purposes only. Neither onefinancials nor its employees hold any interest in recommended stocks. Occasional errors may occur.